In order to test our theories and approaches we have performed both numerical and experimental studies. In this theory validation section we summarize the results of these tests and compare the results with each other. By comparing the theory predictions to numerical or experimental results we will demonstrate you the quality of our approaches we are using here at Multiscale Consulting. It shows that the basic contact mechanics theory is accurate and very flexible in its applications. Note that all the theories and approaches have been coded in the last years resulting in a powerful software tool helping to solve our customers questions.
In case you are interested in our software this section will give you strong arguments for why it is useful to get our software.
When an elastic block with a smooth surface is squeezed into contact with a hard substrate with a nominally flat but randomly rough surface, the two solids usually do not touch each other everywhere but there will be some regions of non-contact. Hence the solids will in general not make contact everywhere in the apparent contact area, but only at a distribution of asperity contact spots. The separation u(x) between the surfaces will vary in a nearly random way with the lateral coordinates x=(x,y) in the apparent contact area. This means that the two interfaces are separated by a finite separation.
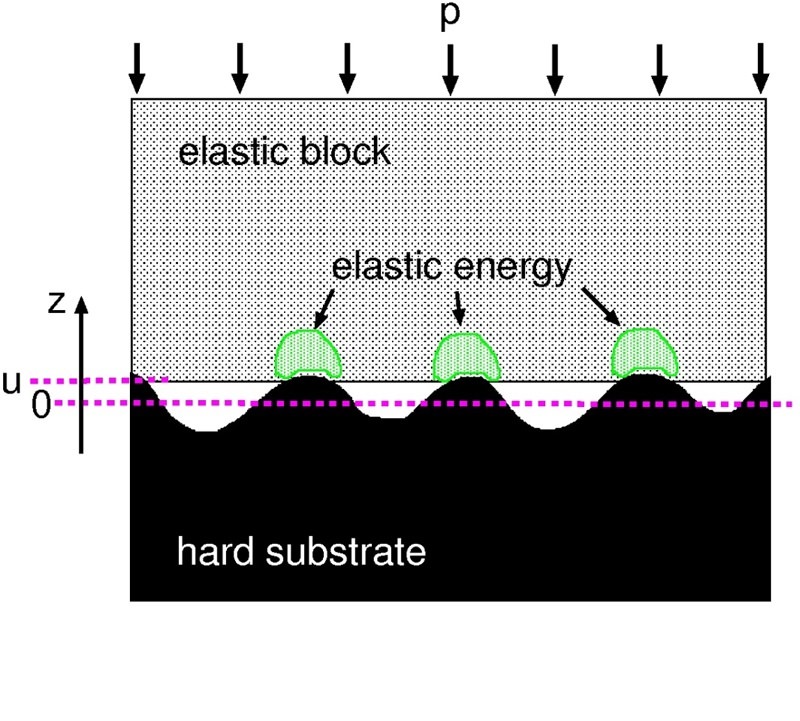
We illustrate this in the figure below, left side. Here is shown the difference between the mean plane of the elastic block and the mean plane of the hard substrate, denoted as 0. The average interfacial separation is indicated as u. A change in the squeezing pressure p will influence the interfacial separation of the two solids. Increasing p will consequently lead to a decrease in the separation, but in most situations it is not possible to squeeze the solids into perfect contact corresponding to u=0. We have studied the average interfacial separation by squeezing a silicon rubber block with a flat surface against an asphalt road surface. While changing the separation we have measured the repulsing force arising from the stored up elastic energy when the rubber block penetrates into the roughness profile of the substrate.
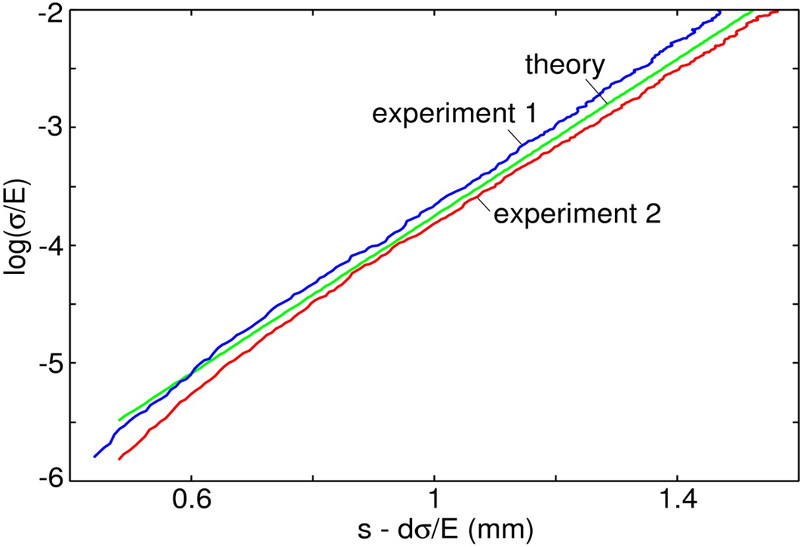
The Persson contact mechanics theory shows that an effective repulsive pressure acts between the surfaces of the form p proportional to exp(−u/u0), where u is the average separation between the surfaces and u0 a constant of the order of the root-mean-square roughness. Comparing the experimental results to the predictions of the theory we find nearly perfect agreement for our system as shown in the figure below, right side.
 |
 |
| An elastic block squeezed against a rigid, randomly rough substrate. The separation between the average plane of the substrate and the average plane of the lower surface of the block is denoted by u. Elastic energy is stored in the block in the vicinity of the asperity contact regions. |
The natural logarithm of the squeezing pressure (divided be the effective elastic modulus) as a function of s -d*sigma/E`, where s is the displacement of the upper surface of the rubber block relative to the substrate, and where d is the thickness of the rubber block. The two experimental curves were obtained using two different silicon rubber blocks, produced in the same way. The results are for dry contact. |
In the right figure we show the repulsing pressure sigma normalized with the elastic modulus E on a logarithmic scale as a function of the average interfacial separation. We learn from this figure that to squeeze the two solids more and more into contact, higher and higher normal pressures have to be applied. Measuring the elastic modulus E, the Poisson's ratio nu and obtaining the surface roughness power spectrum it is possible to calculate the relation between average separation and applied normal stress using the theory. The results are shown as the green curve in this figure. Here we also show the results of two different experiments, using two silicon rubber blocks produced in the same way, as blue and red curves. We found that the agreement for the average interfacial separation is very good for the system which we have studied.
In this combined experimental-theoretical study we could show that the predictions of the theory agrees beautiful with the measured results showing that the theory works very well for calculating the interfacial separation. More information can be found in the related publications.
 |
| Probability distribution P(u) for several squeezing pressures. The red line corresponds to the theoretical prediction and the blue to numerical simulations. |
 |
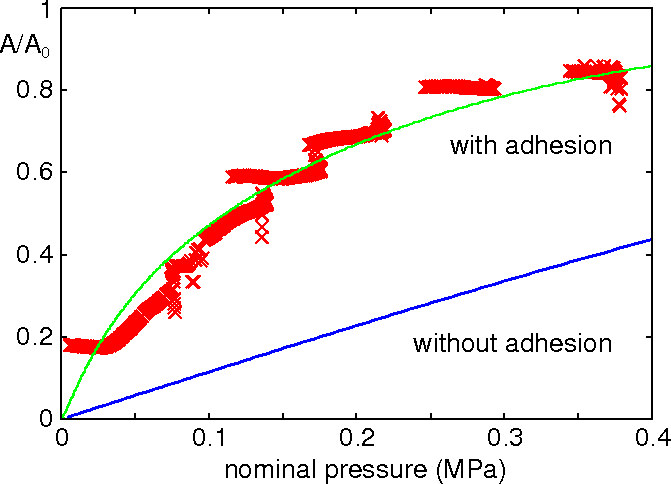 |
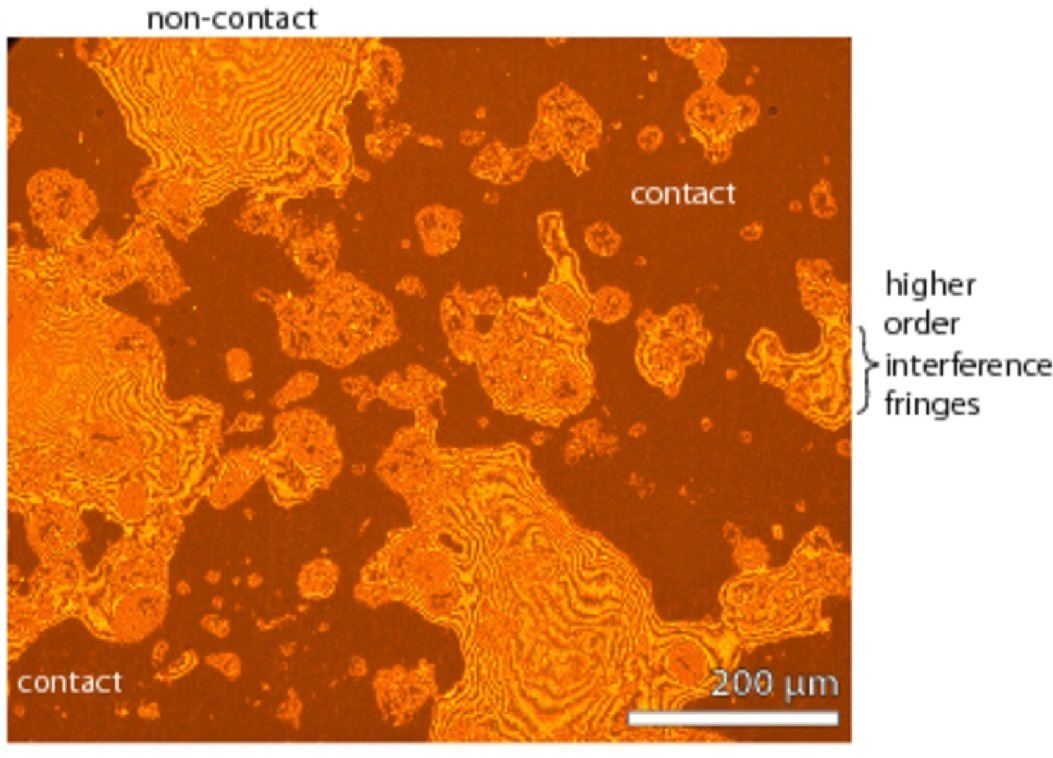
| Optical image of the contact region with darker color indicating contact and lighter color non-contact regions. Also note the interference fringes from which the separation could be calculated. | The measured relative contact area (A/A0, red points) compared to the theory predictions with (green curve) and without (blue curve) adhesion calculated for the particular magnification of the CCD camera. |
 |
 |
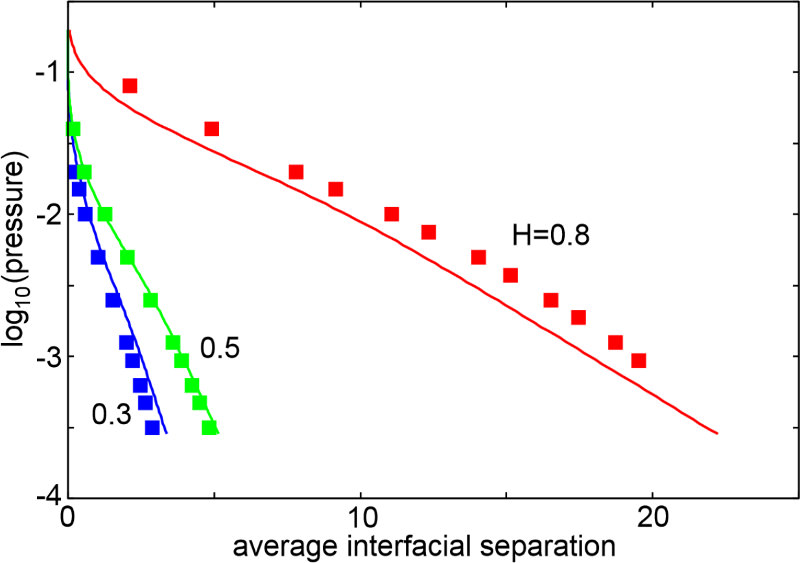
| Relation between applied squeezing pressure p and average interfacial separation u. Comparison between the simulation data (for N = 2048 x 2048) and analytical predictions for surfaces with distinct values of the Hurst exponent H. |
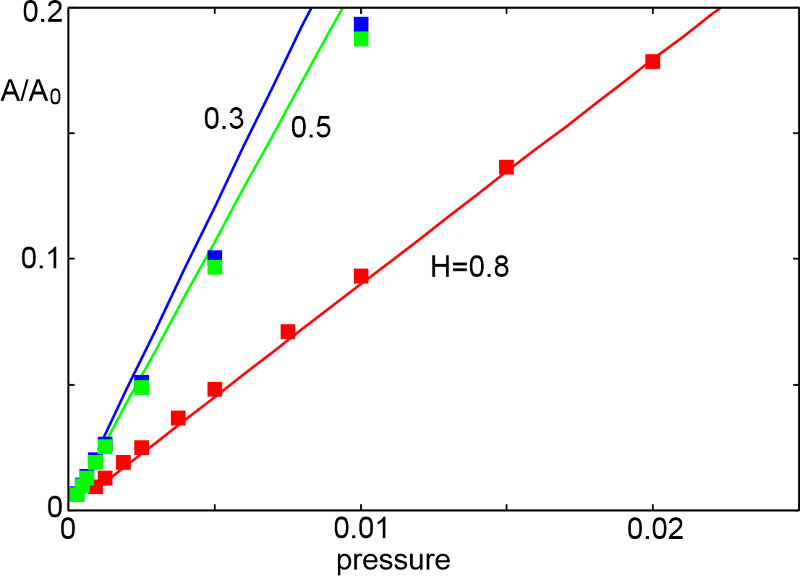
Relative contact area A/A0 as a function of the applied pressure p for the surfaces corresponding to the results shown in the figure on the left. |
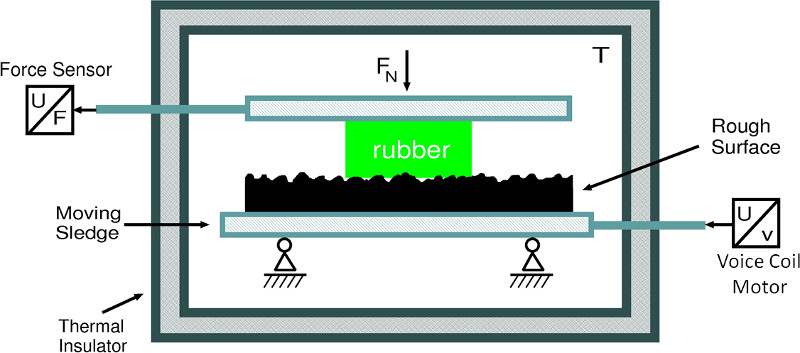
We have tested our rubber friction theory with the following experiment. A rubber block is squeezed with a constant normal force against a randomly rough counter surface which can be moved relative to the rubber block in a translatory manner. The velocity as well as the temperature inside the experiment are controlled and the experiment is repeated at different velocities and temperatures. Below we show results of this test.
 |
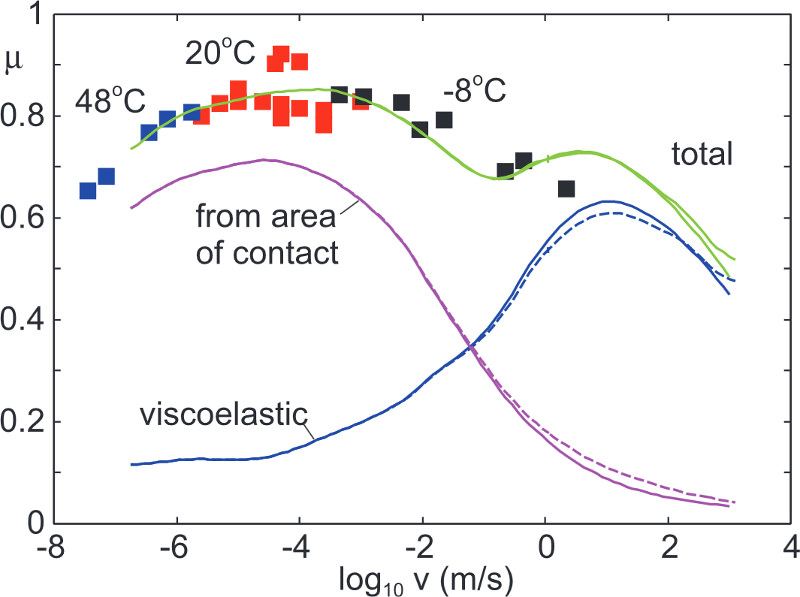 |
| The experimental setup used to test our rubber friction approach here at Multiscale Consulting. A rubber is squeezed into contact with a rough surface with the normal force Fn. The rough surface is moved translatory to the rubber block with constant velocity at a controlled temperature while the friction force on the rubber is measured. | The measured (square symbols) and the caluclated (solid lines) friction coefficient as a function of the logarithm of the sliding velocity for compound A at T0 = 20°C. The green line is the total calculated friction coefficient which is the sum of the contact area contribution (pink) and the hysteretic (blue) contribution. Dashed lines are including flash temperature effects while the solid lines are without. |
The figure on the right shows the measured friction coefficient for a rubber block sliding on an asphalt road surface. The friction coefficient has been measured at different velocities and temperatures resulting in a frictional master curve after sifting the different temperature segments along the velocity axis (similar to TTS in DMA). We compare the experimental results to the predictions for the total friction coefficient (green solid line)obtained from our friction model. Here we find very good agreement between the measurement and the predictions. Note that the total friction is the sum of the viscoelastic (or hysteretic) contribution and the contribution arising from shearing the contact area (pink curve). More information can be found in the related publications.
We study the heat transfer between elastic solids with randomly rough surfaces. We include both the heat transfer from the area of real contact, and the heat transfer between the surfaces in the non-contact regions. We apply a recently developed contact mechanics theory, which accounts for the hierarchical nature of the contact between solids with roughness on many different length scales. For elastic contact, at the highest (atomic) resolution the area of real contact typically consists of atomic (nanometer) sized regions, and we discuss the implications of this for the heat transfer. For solids with very smooth surfaces, as is typical in many modern engineering applications, the interfacial separation in the non-contact regions will be very small, and for this case we show the importance of the radiative heat transfer associated with the evanescent electromagnetic waves which exist outside of all bodies.
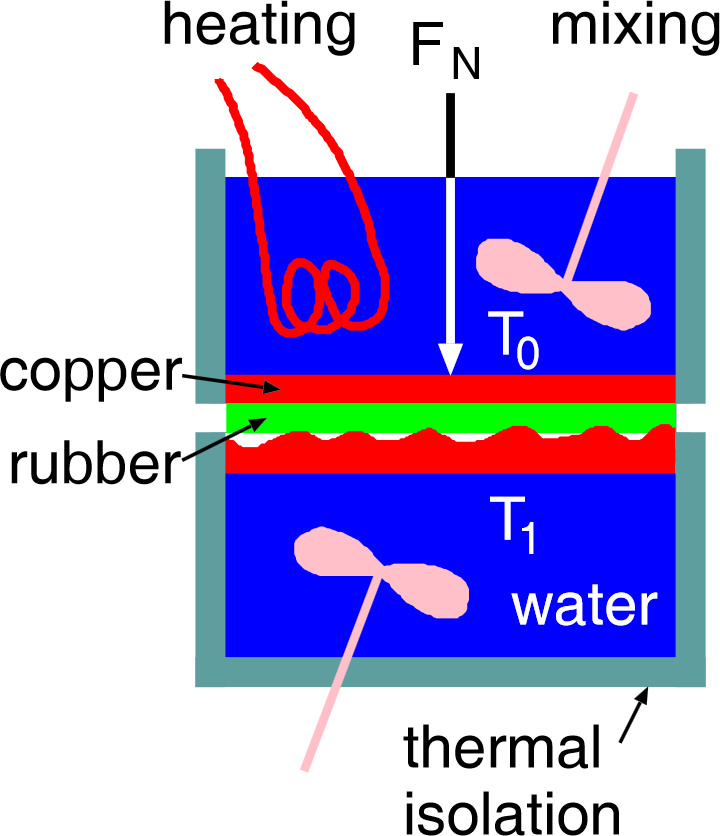
In order to test the theoretical predictions for the heat transfer, we have performed a simple experiment. The setup is shown in the figure below, left side. It consists of two containers, both filled with distilled water, standing on top of each other with a thin silicon rubber film in between. The upper container is made from copper and the water is heated to 100°C. The lower container is made from PMMA with a cylindrica lcopper block at the top. To study the effect of surface roughness on the heat transfer, the copper block can be replaced with other copper blocks with different surface roughness. The temperature of the water in the lower container will increase with time t due to the heat current J0 flowing from the upper to the lower container. The heat transfer via the interface depends on surface roughness and normal force Fn.
 |
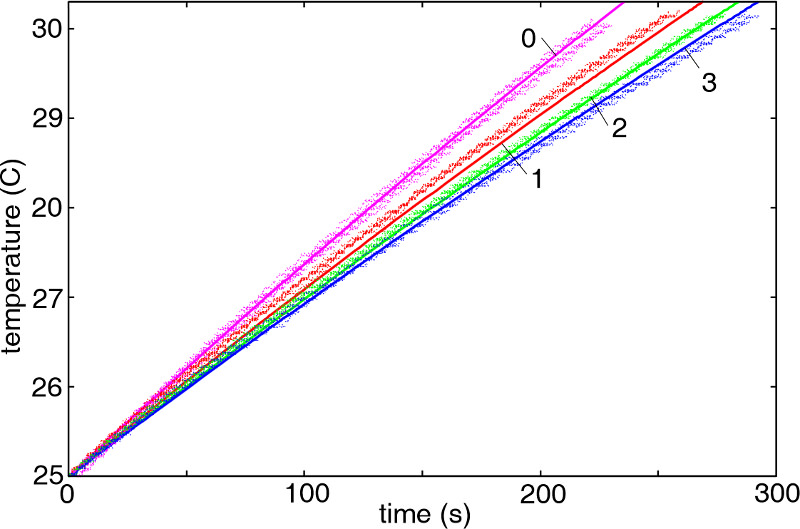 |
| Schematic picture ot the experiment to test the theory predictions for the heat transfer across interfaces. The increase in the temperature T1(t) of the water in the lower container, with increasing time t, determines the heat transfer between the upper and lower water container. | The measured (dots) and calculated (solid lines) temperature in the lower container as a function of time. Results are for 4 different surfaces and for the nominal squeezing pressure p0 = 0.012 MPa. The surfaces used differ in the amount of roughness with 0 being the smoothest and 3 the most rough surface. |
The figure above, right side, shows a comparison of the experimental results with the theory predictions for the setup explained above. The figure shows the temperature of the water in the lower container as a function of time. Both, experimental data and the theory results agree very well with each other. Thus the heat transfer through the contacting interface is well described by the contact mechanics theory which we have develope here at Multiscale Consulting. More information can be found in the related publications.
Understanding the leak-rate of a seal involves understanding the contact mechanics between a rubber seal and the metal counter surface as the fluid flow at the interface occurs via small channels of non-contact. When one knows the size of these channels one can also calculate the fluid flow corresponding to these channels at a given fluid pressure difference. Using the contact mechanics theory, which we have developed at Multiscale Consulting, we succeeded to apply it to this problem and to predict the fluid flow. To test our model we have performed simple experiments where we have a rubber o-ring squeezed against a randomly rough surface with a given squeezing pressure sealing off a water filled pillar.
The experimental set-up is schematically shown in the figure below on the left side.
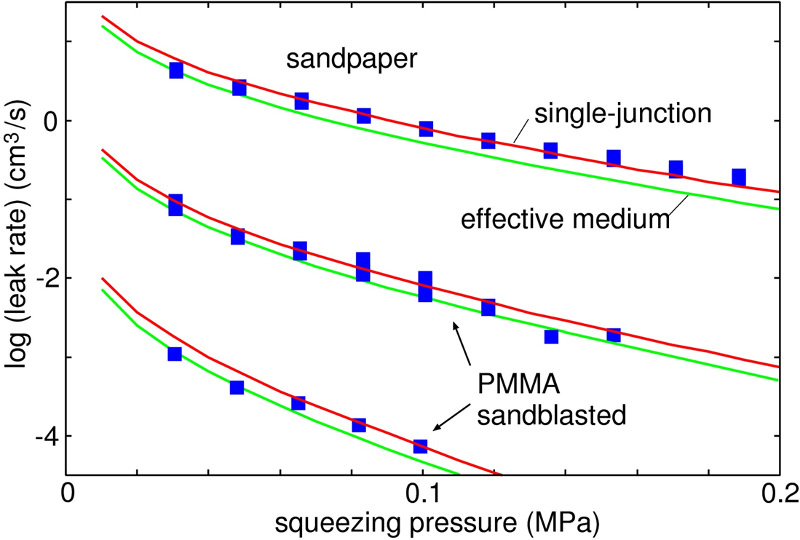
We have measured the leakage on different substrates and compared the results in the figure below. Here we show the leak-rate on a logarithmic scale (with 10 as basis) for different squeezing pressures for a sandpaper and two sandblasted PMMA substrates (blue symbols). The green and red curves are the predicted fluid loss using two different models, both applying the contact mechanics theory of Persson. The very good agreement between predicted and measured leakage shows that the contact mechanics theory gives accurate results as we have calculated real area of contact and interfacial separation to specify the size of the dominant leak channels at the interface. More information can be found in the related publications.
 |
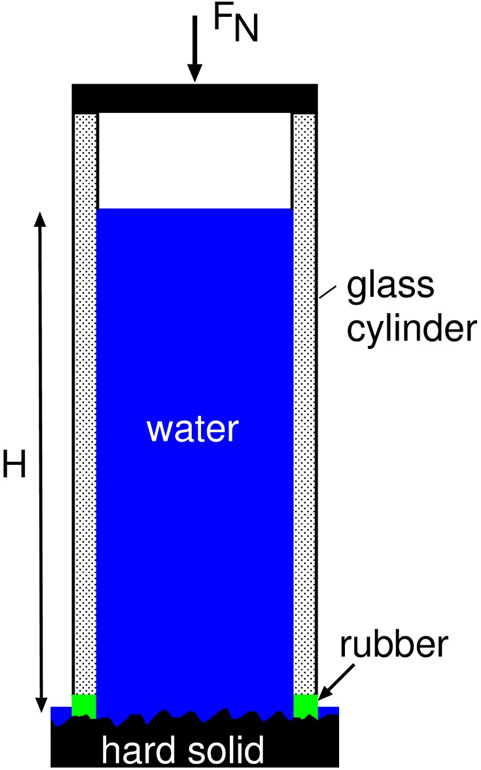 |
| The measured leak-rate for a PDMS o-ring seal squeezed against sandpaper or sandblasted PMMA surfaces. The fluid used is water and the pressure difference of order 0.1 bar. | Schematic picture of the experimental set-up to test the leak-rate predictions. |
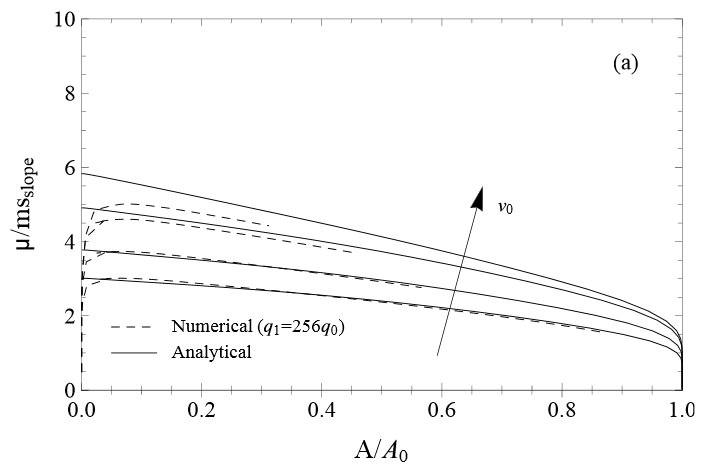
To test the viscoelastic energy dissipation when a rubber block is in sliding contact with a hard, rough counter surface, we have performed exact numerical studies and compared the calculated friction force and contact area to the theory predictions. The numerical system consists of 256 x 256 points and the friction coefficient has been calculated for several different velocities as a function of the relative contact area as shown in the figure below.
 |
|
The friction coefficient, divided by the rms slope, as a function of the (normalized) area of contact A/A0, for several sliding speeds: v = 0.01, 0.1, 1, 10 m/s. The solid lines are the theory predictions, while the dotted lines are from the exact numerical study. |
The figure shows that for a broad range of velocities the frictional description of the Persson theory (solid lines) is well backed up by the results of the numerical simulation (dashed lines). Note that for small relative contact areas the results start to deviate from each other. This is a finite size effect as the numerical study is over a limited mesh of points only while the theory assumes an infinite sized system. Apart from that the viscoelastic energy dissipation is very well characterized by the approach of Persson. Note that additional complications such as flash temperature effects or the cut-off wave vector are neglected in this study.
Running sport media | Patike – Nike Air Jordan, Premium, Retro Klasici, Sneakers , Iicf