
The figure below illustrates the latest version of our rubber friction software for Windows:
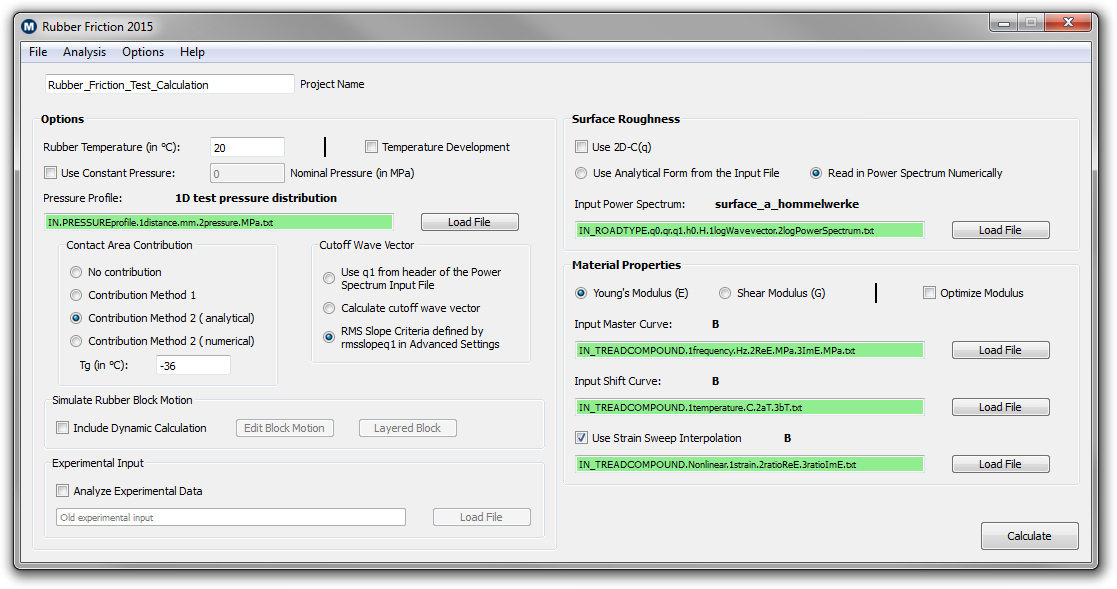 |
| Windows version of the rubber friction software |
The figure of the interface illustrates that the software does not require any fitting parameter input. The information which needs to be specified is directly output from the other software which we have developed. Below we show some results to demonstrate the output of the program. First we show the calculated total rubber friction coefficient (green dotted line) as a function of log10 of the velocity. The solid green curve represents the total friction coefficient including temperature effects.
Here two different dissipation mechanisms are taken into account, the viscoelastic deformations of the rubber due to the roughness profile (blue curves) and the contact area contribution resulting from shearing the real area of contact (red curve). For all curves the dotted line is without flash temperature while the solid line includes flash temperature effects.
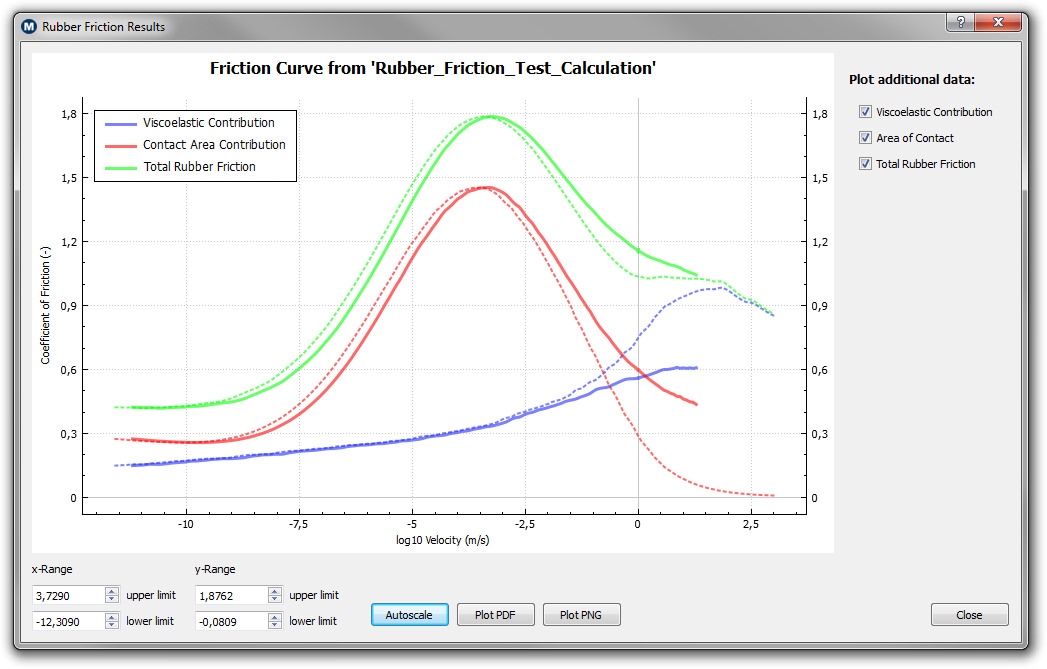 |
| The coefficient of friction as a function of the sliding velocity (green curves, with log10 as basis). Shown are the contribution from viscoelastic deformations (blue curves) and from shearing the contact area (red curves). The dotted lines neglect temperature effects while the solid lines are with flash temperature in the contact. |
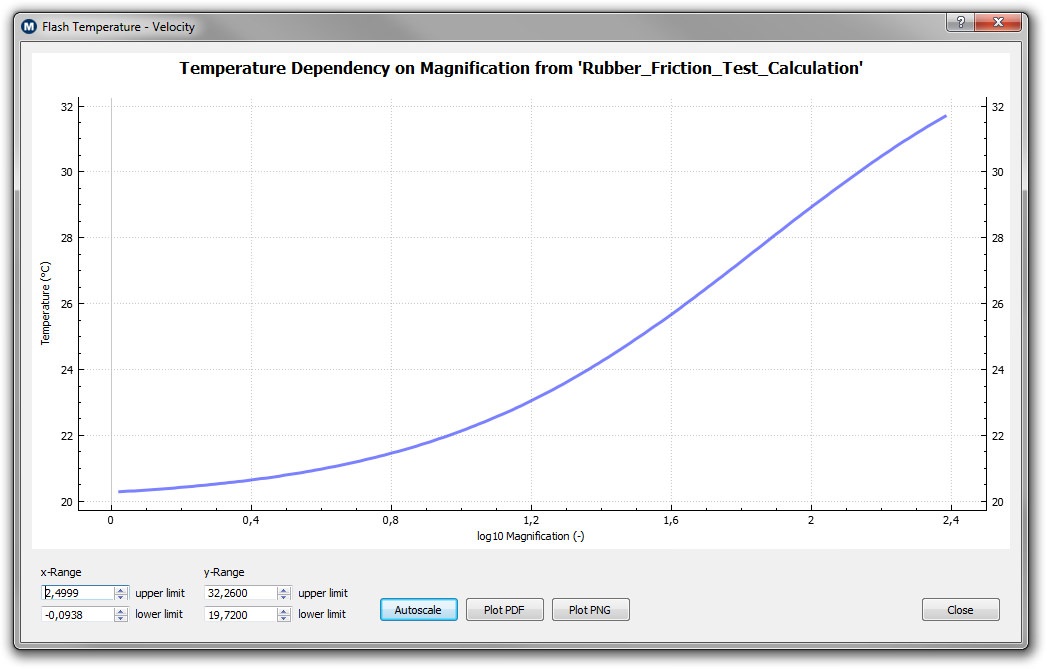
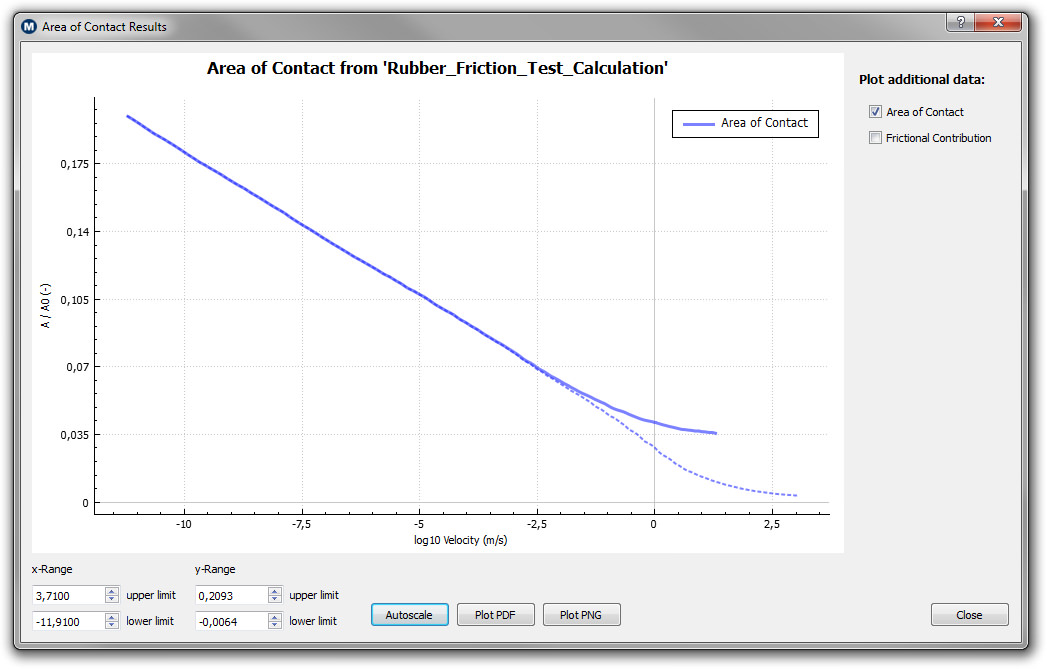
Below are two additional plots showing the dependency of the flash temperature on the magnification or resolution (with log10 as basis) on the left and the real area of contact as a function of the velocity (with log10 as basis) on the right. One can see that the rubber bulk temperature on large length scales is basically unchanged compared to the background temperature which was 20°C in this calculation. The smaller the volume element which we consider in the contact, or the larger the resolution, one can find higher temperatures at the interface.
The other figure shows how the real area of contact decreases with increasing velocity. The reason for this is that the rubber material becomes effectively stiffer as with increasing velocity the frequencies induced by the surface roughness asperities gets larger. Note also that when including flash temperature effects the contact area is quiet a bit larger at high velocities. This is due to a shift of the viscoelastic modulus to higher frequencies with increasing temperature. The rubber becomes effectively softer again.
 |
 |
| Temperature in the contact as a function of the magnification (with log10 as basis) |
Area of contact as a function of sliding velocity (with log10 as basis) |
In the rubber friction program there is also a simple 2D tire model included as described in the second reference above. Here one can learn how, e.g., the footprint shape influences the dynamics of the tire or simulate an ABS braking situation. The tire model also shows that it is easily possible to implement the rubber friction code in an already existing tire model!
For further information on the rubber friction software please consider the following information:
| The manual of the rubber friction software for the Windows version. | Coming Soon |
| The Data.Out file is a summary of the different options chosen for a particular calculation. The options are briefly explained and the most important results summarized. The Data.Out file is always created after the calculation is finished. | Download Data.Out |
| An example rubber friction output file. | Download Example Rubber Friction Results |
In case you are interested in using the rubber friction program or you have further questions concerning the software please feel free to contact us.
bridge media | off white nike blazer retail shoes Verona Multi-Color DJ5065-144 , Fitforhealth