Below we show the latest user interface of the windows version of the multiscale contact mechanics software:
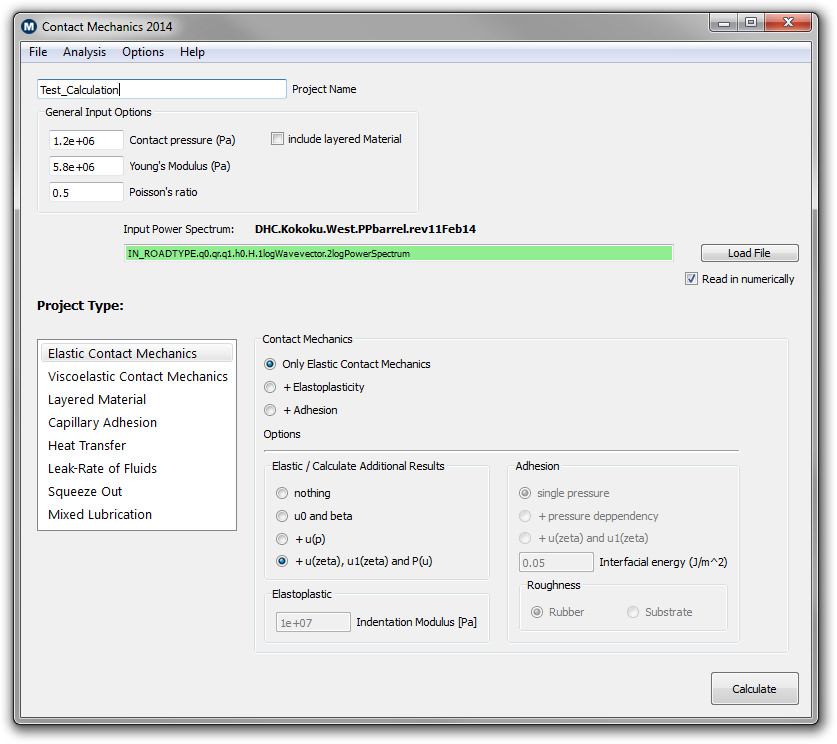 |
| Windows Version of the multiscale contact mechanics software |
Note that the program is a powerful tool which not only solves elastic contact mechanics. It can also be applied to related problems such as:
|
The heat transfer module describes the heat current from one solid to another via the contacting interface. It takes into account the heat flow through the real area of contact and the non-contact area (via convective processes, radiative heat transfer or the propagating electromagnetic waves). Please see this publication for more information.
Squeeze-out of a fluid from the contacting interface is another important topic which is addressed by our software, especially in lubrication or when a tyre is rolling on a wet road. The program can calculate the squeeze-out as a function of time, nominal pressure and viscosity (see publication for more information).
Also note that most of the submodules have been tested both numerically and experimentally. A numerical test is for example to compare the theory predictions to results exact numerical results obtained for small system sized FEM simulations for example. As contact mechanics involve surface roughness on a large number of length scales, numerical simulation would have to take into account too many degrees of freedom for the computer today. Even with the latest supercomputer it would not be possible to solve these systems within a sufficient time period.
More information on the validation of the theory we refer you to our validation section. Here we show how we have performed specially designed experiments and numerical simulations to test the Multiscale Consulting approach on contact mechanics and rubber friction. Below are shown some results obtained with the multiscale contact mechanics software.
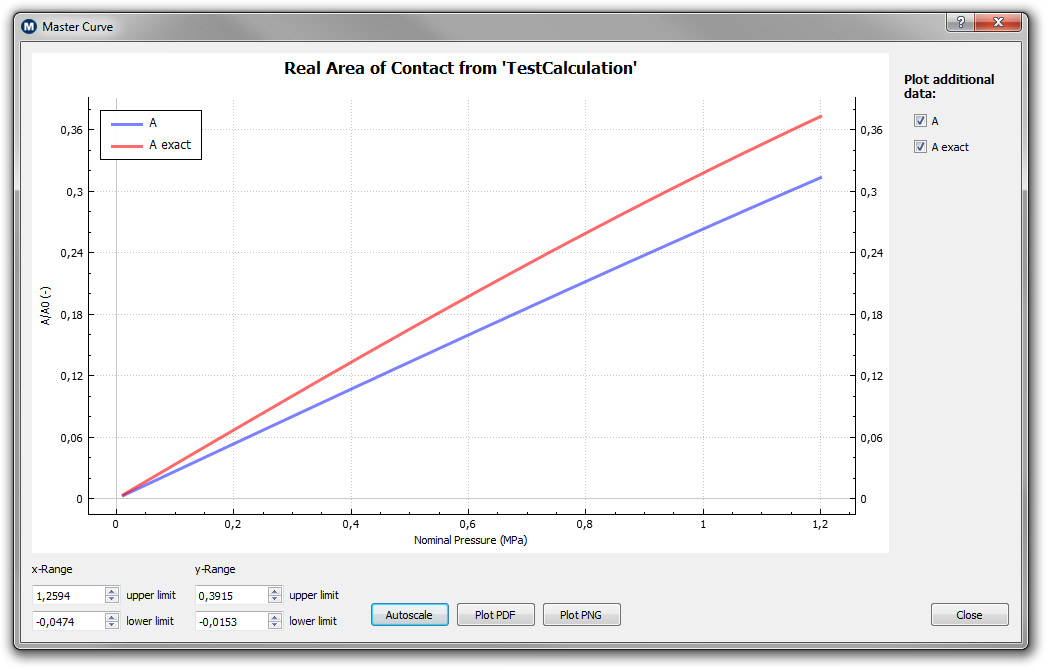
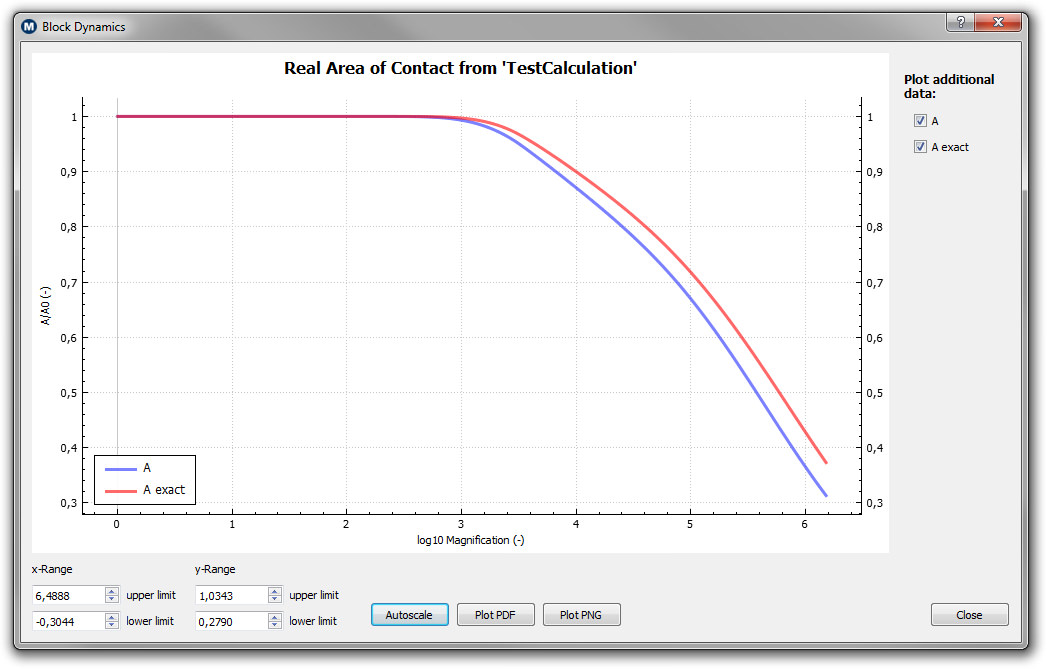
In the figure on the left is shown the real area of contact between an elastic solid squeezed into contact with a hard and randomly rough solid. The plot shows how the contact area increases with increasing nominal force. On the right you see the real area of contact as a function of the logarithm (with 10 as basis) of the magnification. The lower the magnification under which the system under investigation is observed the less roughness components can be resolved. At magnification 1 there are no surface roughness asperities and hence the real area of contact A1 divided by the nominal contact area A0 is 1 or 100%. When increasing the magnification, and hence improving the resolution, more and more roughness can be observed and the contact area consequently decreases. The true area of contact can be written of this graph at the magnification where atomic resolution is reached.
 |
 |
| A plot of the real area of contact at the highest magnification as a function of the nominal pressure |
The real area of contact and its dependency on the applied magnification |
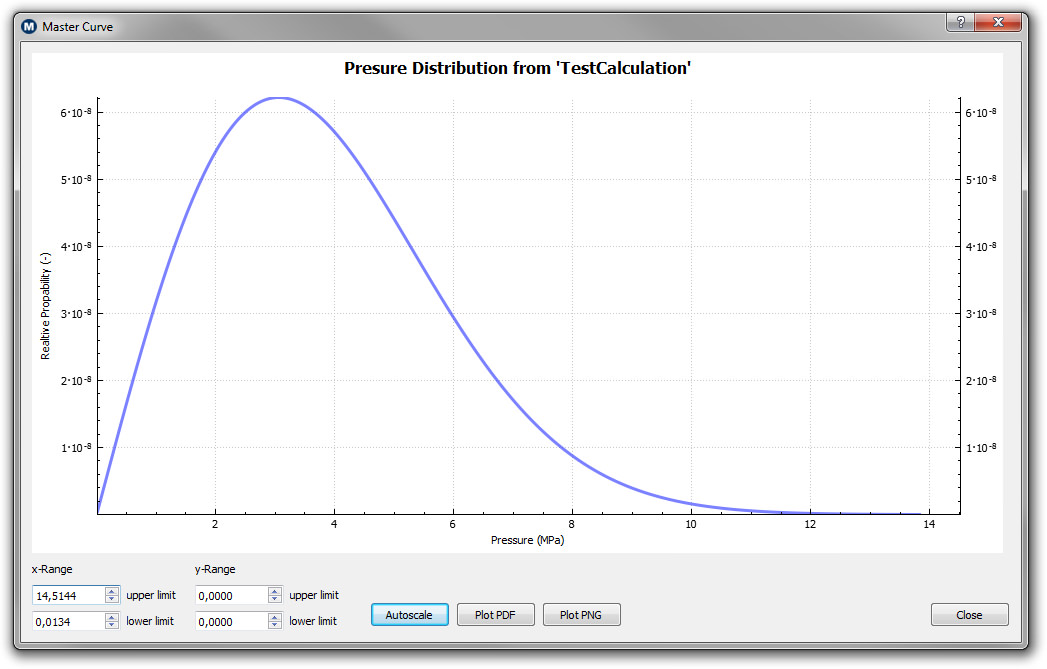
Below are shown the pressure distribution on the left and the calculated leak rate of a static seal on the right. The pressure distribution gives information on the acting contact pressures in the regions of contact. Here is shown the relative probability as a function of pressure. The curve has to start at 0, exhibits a maximum at a finite pressure and extends with a tail to higher pressures. The integral of the curve shown in the graph gives the applied nominal pressure.
On the right is the logarithm (with 10 as basis) of the leak-rate as a function of the normal pressure applied on the seal. One can see that the leakage depends very strongly on the contact pressure in the beginning of the graph at low pressures. Note that the y-axis is on a logarithmic scale! By doubling the contact pressure the leakage can be changed by orders of magnitude. For high contact pressure a dramatic decrease in the leak-rate can be observed until a very small, finite value is reached. Basically the pressure applied is here large enough to seal off the small leak channels through which the fluid moves. The percolation threshold of the seal is reached and no fluid can flow from the high to the low pressure side. The finite value which is reached is basically a numerical 0.
 |
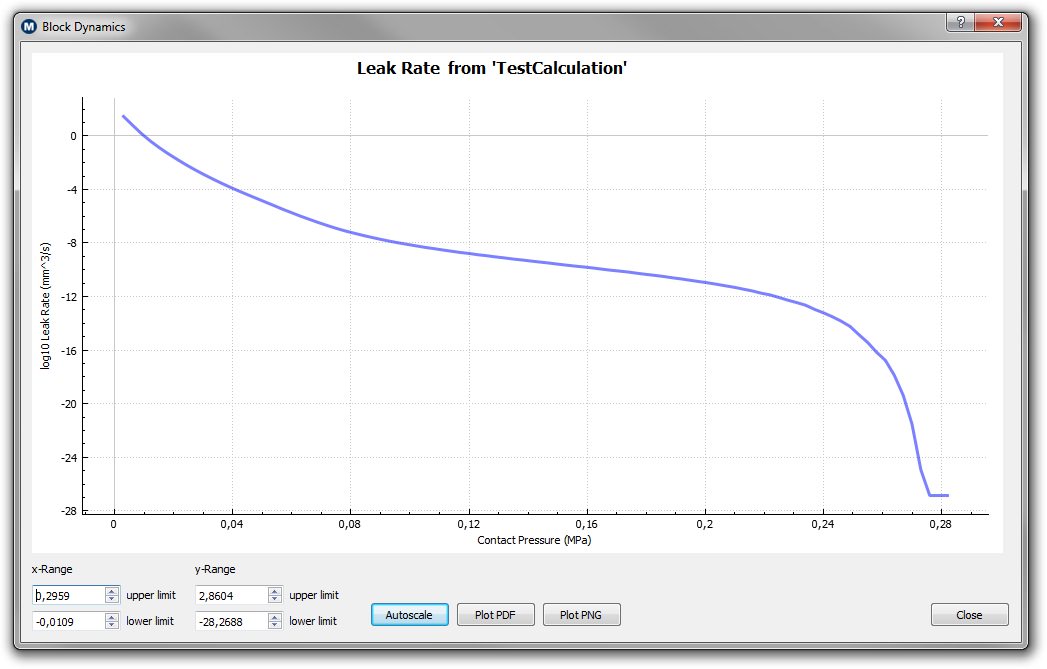 |
| The pressure distribution function in the contact regions | The leak rate of a static seal (with log10 as basis) as a function of |
For further information on the contact mechanics software please consider the following information:
| The manual of the contact mechanics software for the Windows version. | Coming Soon |
| The Data.Out file is a summary of the different options chosen for a particular calculation. The options are briefly explained and the most important results summarized. The Data.Out file is always created after the calculation is finished. | Download Data.Out |
| An example contact mechanics output file. Contact area as a function of nominal pressure. | Download Example Contact Mechanics Results |
| An example contact mechanics output file. Contact area as a function of magnification. | Download Example Contact Mechanics Results |
| An example contact mechanics output file. Pressure distribution at the interface. | Download Example Contact Mechanics Results |
In case you are interested in using the contact mechanics program or you have further questions concerning the software please feel free to contact us.
Sports Shoes | Best Selling Air Jordan 1 Mid Light Smoke Grey For Sale 554724-092